Economic Inequality: Part 1
“The triumph of globalization and market capitalism has improved living standard of billions [of people] while concentrating billions [of dollars] among the few.”
~Richard Freeman, Harvard Economist
Introduction
Like most things, we maintain vastly differing views about economic inequality. Some of us believe such inequality is wrong (not “Good”), particularly since (as these folks believe) such disparity comes as a result of greed and unfairness. Other folks believe such inequality is inevitable and, therefore, assume nothing should be done to prevent it. Regardless of the cause or need for prevention, various research indicates that long term economic inequality in a society comes at a high cost. While the costs are many, they basically fall into two main categories: psycho-physical deterioration and sociopolitical upheaval.
We will examine these two outcomes—these two sets of “wages”—in two separate articles. This week we will look at inequality as a construct and touch on some of its psycho-physical consequences. In a subsequent week, we will explore the sociopolitical ramifications of such inequality.
A note about form. There are many numbers and graphs presented in this article (which is to suggest that, for many of us, this post is quite dry). Numbers can be informative. Numbers can also obfuscate. Part 1, which contains many general statistics about economic inequality, is presented as background for Part 2. We have attempted to present hard, “factual” information and links so you can check out the statistics for yourself. Assuming, however, that numbers present only relative measures of so-called ”truth” or if you simply do not care about numbers, skip to the section on “How are you doing?” which you will probably find somewhat provocative.
What is economic inequality?
While we often use the phrase “economic inequality” presumptuously, assuming its meaning, perhaps a closer look is in order to insure that, in fact, we really do understand what it means. Here is a 10 minute crash course (video) that might help.
 Not all inequality is … equal. There are two kinds of economic inequality: wealth and income. Wealth inequality represents accumulated assets minus liability – i.e., savings, pension, real estate and stocks. Income inequality is related to the assets (usually money) that are continually added to personal wealth. Economic inequality, then, refers to the degree to which we are unequal in how much wealth we possess (sometimes called “net worth”) and how much wealth we acquire.
Regardless of sociopolitical persuasion, research indicates that not only does a large gap exist between individuals possessing a great amount of wealth and those we would consider “poor”, but furthermore, that gap is growing. As the video states, “It is true that the people in the lowest income brackets have earned a little more in the last 40 years. But in the last 20 years, that average income has been falling. Meanwhile, the rich have continually gotten richer.” But are we really that unequal in our wealth?
Not THAT Unequal?
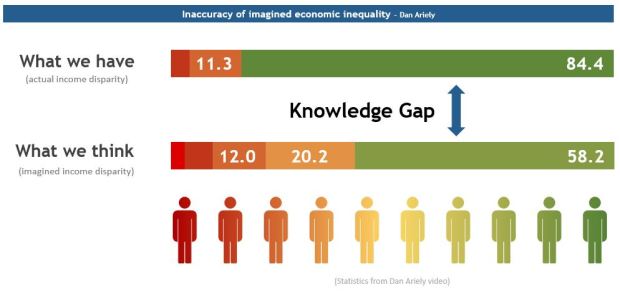
Many do not believe the wealth and income gap is actually ”that large”. One reason for such disbelief is usually that either those non-believers have not actually read n4or heard specific statistics (such as stated in the above video). Others are privy to the stats but do not fathom the significance of these numbers. Duke University psychology professor Dan Ariely suggests that we (as non-wealthy individuals) think we have relatively more wealth than we actually do and we think the “wealthy” possess far less than they actually have.
How much wealth do you think is concentrated in the bottom 40%? When Mr. Ariely polled individuals about relative wealth, most assumed the bottom 40% possess approximately 10% of all possible wealth. Similarly, these same responders assumed that the top 20% possess approximately 60% of the all wealth. As you have already seen in the video above, such estimates are way off. Mr. Ariely explains in this video.
Actual Income Disparity

The above graph shows world wealth distribution. U.S. statistics are even starker. While this or similar information can be obtained from a variety of source, here is a link to “Income Inequality in America”, an article which appeared on thebalance.com website on May 08, 2018. In addition to listing some rather bleak statistics for low-wage earners, the article also mentions cheap foreign labor, outsourcing, and recent government tax policies which benefit stock holder more than workers as representing major drivers of inequality. The article also notes that, as reported in the Wall Street Journal, “technology, not globalization, feeds income inequality.”
The Technology and Education Gap
Most experts agree that early human societies were largely economically equal. The rise of technology created differences in the capabilities of societies to exploit natural resources and sociocultural processes such as farming and manufacturing. Indeed, the industrial revolution, having erupted and largely manifest in Western countries is the cause of much of the dramatic economic disparity between so-called “developed” and “undeveloped” nations.
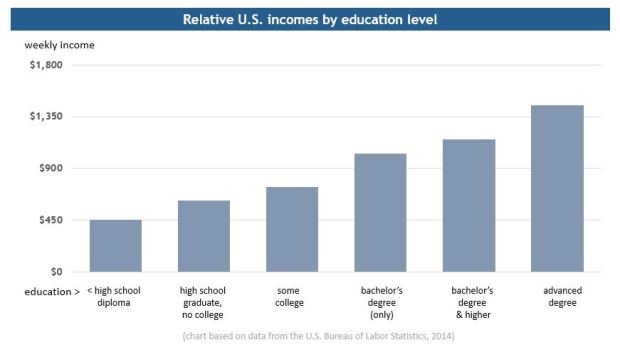
Disparities in education have also played a role in creating economic inequality. In the U.S. for instance, as noted in the video above, there are more non-college graduates than just a few years ago, which has led to an income gap generated by a lack of a college education. Simultaneously, income for non-college folks has decreased.
In a report issued by the Federal Reserve Bank of St Louis, education was ranked as a strong indicator of relative income. Simply stated, higher education means higher pay.
(A note about numbers: Many numbers presented within this article, as is true of most statistics must be understood in context. That context is not always altogether obvious nor is an appropriate interpretation automatically forthcoming. For those who really want hard number, a vast array of statistics can be obtained from the Bureau of Labor Statistics website , various economic agencies that compile economic statistics, and elsewhere).
How are you doing?
We could quote the figure $55,322 as the median household income in the United States based on the 2015 U.S. Census. But how many people actually understand the significance of the term “median” or the difference between median and average (or “mean”)? Numbers are interesting, but where do we as individuals fit into all of this?
According to the Business Insider, “You need a $150,000 income to lead a good life in America.” That is a bold statement. But what determines this so-called “good life”? A group of folks were asked to rate their lives based on the following criteria:
- I can’t even afford the basics
- I can barely afford the basics and nothing else
- I can afford the basics plus some extras
- I can afford the basics, the extras, and I’m able to save
According to a survey based on these criteria, the last category requires an annual income of $150,000. In the richest country in the world, more than 50% of Americans fall into the first category – not really even getting by. So, how are you doing?
 This $150K figure is not based on expensive metropolitan areas. This $150K “minimum” equates to a required $337,312 in New York City and $218,128 in Washington, D.C., for instance. The survey concludes, “while six figure incomes used to represent affluence, that’s no longer the case.”
Profit Over People
CEO’s acquire tens of millions of dollars every year as compensation for their work while workers for their respective companies might easily earn a paltry $30 to $40 thousand per year (if that). Does the CEO really work that much harder? Is the CEO really that much more diligent? (In a video presented in Part 2 of this article, a self-described “plutocrat” discusses the disparity between CEO compensation and the rest of us.) If a large portion of workers could somehow decide NOT to work for a particular CEO’s company any more, the company could fail, bringing that $50,000,000 salary to a screeching halt. No, not really. But you get the idea. This situation will never happen. Those workers need to survive and cannot quit their jobs—which is a part of the setup.
Both technology and education generate and disseminate what we might call “capital of capability”. Just as superior technology has always given those who possess it an edge over those who do not, we must do all we can to insure that we and those around us are at least as “wealthy” as possible in knowledge—knowledge that slips through the cracks of assumptions like those described by Dan Ariely (above).
Many, perhaps most of us, barely “get by”. But is “getting by” really an appropriate measure of well-being for the richest country in the world, or for any country for that matter? The acquiescent attitude which allow this minimal criteria to persist as an acceptable measure of EveryDayLife represents the primary reason for the perpetuation of economic inequality we experience daily. We do so to our own detriment.

The Wages of Inequality
So what are the stakes? What do we risk by allowing economic inequality to not only persist, but to thrive and deepen? One of the primary outcomes of long term inequality is the deterioration of physical and psychological health of those at the bottom of the hierarchy. The graph below, presented by epidemiologist Richard Wilkinson, shows differences between countries regarding the ill effects of sustained economic inequality. Relatively low income individuals in countries with the greatest disparity of economic inequality (such as the U.K., Portugal and the United States) suffer significantly more psychological and physical maladies and deficiencies (topics listed under “Index of”).
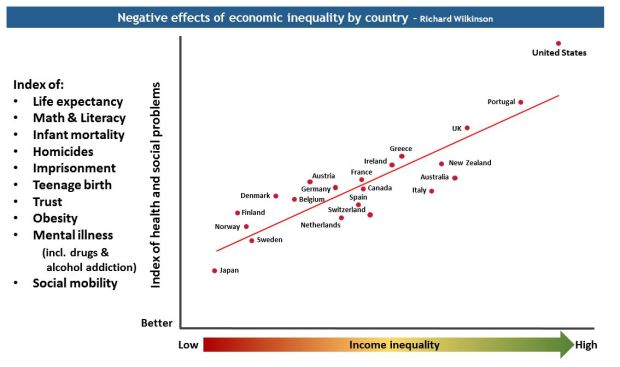
As Mr. Wilkinson suggests, economic distinctions between countries might not matter to the person on the street. On the other hand, research suggests that economic disparity within countries can be catastrophic. In his explanation of the inequality dynamics within countries, Mr. Wilkinson presents some disturbing statistics regarding the effects of economic inequality (such as the high rate of mental illness among lower income individuals in the U.S.—at the top of the inequality scale—as compared to other countries).
Few of us at seekingGood are ideological socialists and fewer still identify as communists. Yet who among us can come away from even a superficial understanding of the above graph or similar information without a sense that something within the economic landscape of the U.S. and the world is far from “Good”? Something must be done. Some things need to change. There are many possibilities. Ideas about “basic income” (or “universal basic income” – UBI) have been floated in our public space and even attempted in various parts of the world. Most of us have heard of it; few have even cognitively ventured beyond mild curiosity or dismissal. How about “job guarantee” (which many of us have not heard about) proposed by economists Stephanie Kelton and Pavlina Tcherneva and more formally presented by Senator Bernie Sanders? Several possibilities exist. Some could be painless, other not so much. Until we act, nothing will change—or certainly not for the better. At the very least, to get to a long term solution, we all need to pay attention to our situation and attempt to increase the capital of capability we and others possess.
Red and Blue Pills
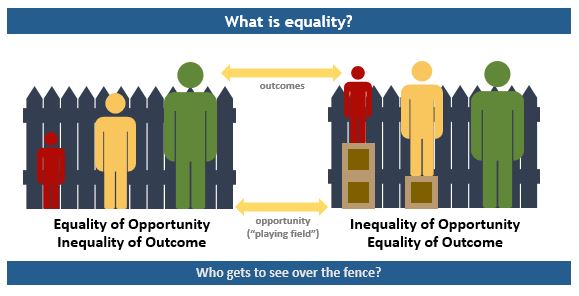
What is equality, really?
Just how accurate are the above illustrations?
So the world is a terribly unequal place that grows more unequal all the time, right? Numbers don’t lie, right? Sure, numbers do not ever lie. But numbers do not operate on their own to communicate ideas to people. Such is evident in a video which purports to show “5 Inequality Myths”. As has been our custom at seekingGood, do not take our view of any idea. Find out for yourself. Think it through. Take a look at this “Learn Liberty” video, then see what you think about the general issue of inequality.
The “5 Inequality Myths” video presents several interesting confounds to the issue of economic inequality. However, if you listen closely to the presentation, you will hear quite a few subtle assumptions and conclusions which might or might not be true. (Indeed, even the opportunity/outcome illustration above, which is presented in the video, can be considered suspect in its conclusions). The bottom line which the video does NOT present is the EveryDayLife experience of people. This continual experience of economic disparity, defined by the people themselves, seldom if ever focuses on numbers. The concerns of these folks—of most of us—center primarily on daily life experience.
So which do you think is more important? If a statistic suggests that more people have cell phones now than twenty years ago, does this mean that our lives are improving (as is one of the conclusions of the “5 Inequality Myths” video)? Does so-called “inequality of opportunity” achieved through remediation represent “inequality” or what might be termed “managed or insured equality” (i.e., attempts to even the “playing field”)? Additionally, should we focus on a glass-half-full idea about progress as recently presented in Steven Pinker’s book Enlightenment Now, assuming our lives are getting better? Alluding to a key scene in the movie, The Matrix, which pill should we choose as our primary focus in life?
Optimism can greatly improve our experience of EveryDayLife. Unfortunately, continued star-gazing alone can result in some rather nasty, unexpected falls as a result of tripping over dangers right in front of us. A second result of long term inequality is that those at the bottom get “mad as hell” and refuse “to take it anymore”. This idea–revolution–represents the topic of Part 2.
